Drupal 9 DevOps: a Recipe For Setting Up Xdebug 3 With Lando and PHPStorm
For my local Drupal development environment over the past few years, I’ve been quite happy using Docksal for my projects. Recently, I onboarded to a new project that required me to use Lando, another popular local development server. In addition, I use PHPStorm for coding, an integrated development environment or IDE. When I am coding, I consider Xdebug to be of immense value for debugging and defining variables.
Xdebug is an extension for PHP, and provides a range of features to improve the PHP development experience. [It's] a way to step through your code in your IDE or editor while the script is executing.
Getting started: the basic setup
In this article I will share with you my basic setup to get up and running with Xdebug 3. The core of this tutorial requires Lando and PHPStorm to be running on your machine. You can head over to GitHub to grab the latest stable release of Lando. Installing Lando will also install Docker desktop, a containerized server environment. You'll also need PHPStorm to be installed as well. If you have any issues with getting Lando running, you can check their extensive documentation. You can spin up a Drupal 9 site using Lando but as of yet, there is no option that will set it up as a true composer based workflow. Therefore, you can use Composer itself composer create-project drupal/recommended-project to create a new Drupal 9 project and then initialize it with Lando. In this case, you'd need Composer 2 to be setup globally on your local machine but once Lando is up and running, you can then switch to using lando composer... Thereafter, be sure to install Drupal as well.
Configure the Lando recipe
Lando has the notion of "recipes" for specific server setups and you'll want to set up a basic Drupal 9 site running on Lando. The TL;DR for the one I am using is below. This code would go in your .lando.yml file in the root of your project. Noting that any time your change your recipe, you will need to run lando rebuild -y.
name: d9sandbox
recipe: drupal9
config:
  php: "7.4"
  composer_version: "2.0.7"
  via: apache:2.4
  webroot: web
  database: mysql:5.7
  drush: true
  xdebug: true
  config:
    php: lando/config/php.ini

services:
  node:
    type: node:12.16
  appserver:
    xdebug: true
    config:
      php: lando/config/php.ini
    type: php:7.4
    overrides:
      environment:
        PHP_IDE_CONFIG: "serverName=appserver"

# Add additional tooling
tooling:
  node:
    service: node
  npm:
    service: node
Of note in the above code:
- Xdebug set to
true - PHP set to
7.4 - MySQL set to
5.7 - Composer set to
2.x - Pointer to a custom
php.inifile where we will need additional configuration for Xdebug.
Configure php.ini
Now, we need to create our php.inifile within lando/config. Create these directories if they do not exist already. You'll want to set these variables for Xdebug:
[PHP]
xdebug.max_nesting_level = 256
xdebug.show_exception_trace = 0
xdebug.collect_params = 0
xdebug.mode = debug
xdebug.client_host = ${LANDO_HOST_IP}
xdebug.client_port = 9003
xdebug.start_with_request = yes
xdebug.log = /tmp/xdebug.log
I also like to add memory_limit = -1 to this file as well to avoid any out of memory issues. Also note that port 9003 is set for Xdebug, that is because Xdebug 3 requires this. If you've used an older version of Xdebug in the past, the port was typically 9000.
Rebuild Lando
Now that we have Lando all set, go ahead and run lando rebuild -y so that these updates take effect. Once that is done, you'll see something like this in terminal:
NAME            d9xdebug
LOCATION        /Users/me/Projects/d9xdebug
SERVICES        appserver, database, node
APPSERVER URLS  https://localhost:55165
                http://localhost:55166
                http://d9sandbox.lndo.site/
                https://d9sandbox.lndo.site/
Once that is done, go to your site and make sure it loads. In my case the url is http://d9sandbox.lndo.site/.
Configure PHPStorm
Now we are ready to configure PHPStorm. Here, we will connect Docker to the IDE. The following below is a series of screen captures that illustrate how to set this up.
Choose a language level and a CLI interpreter
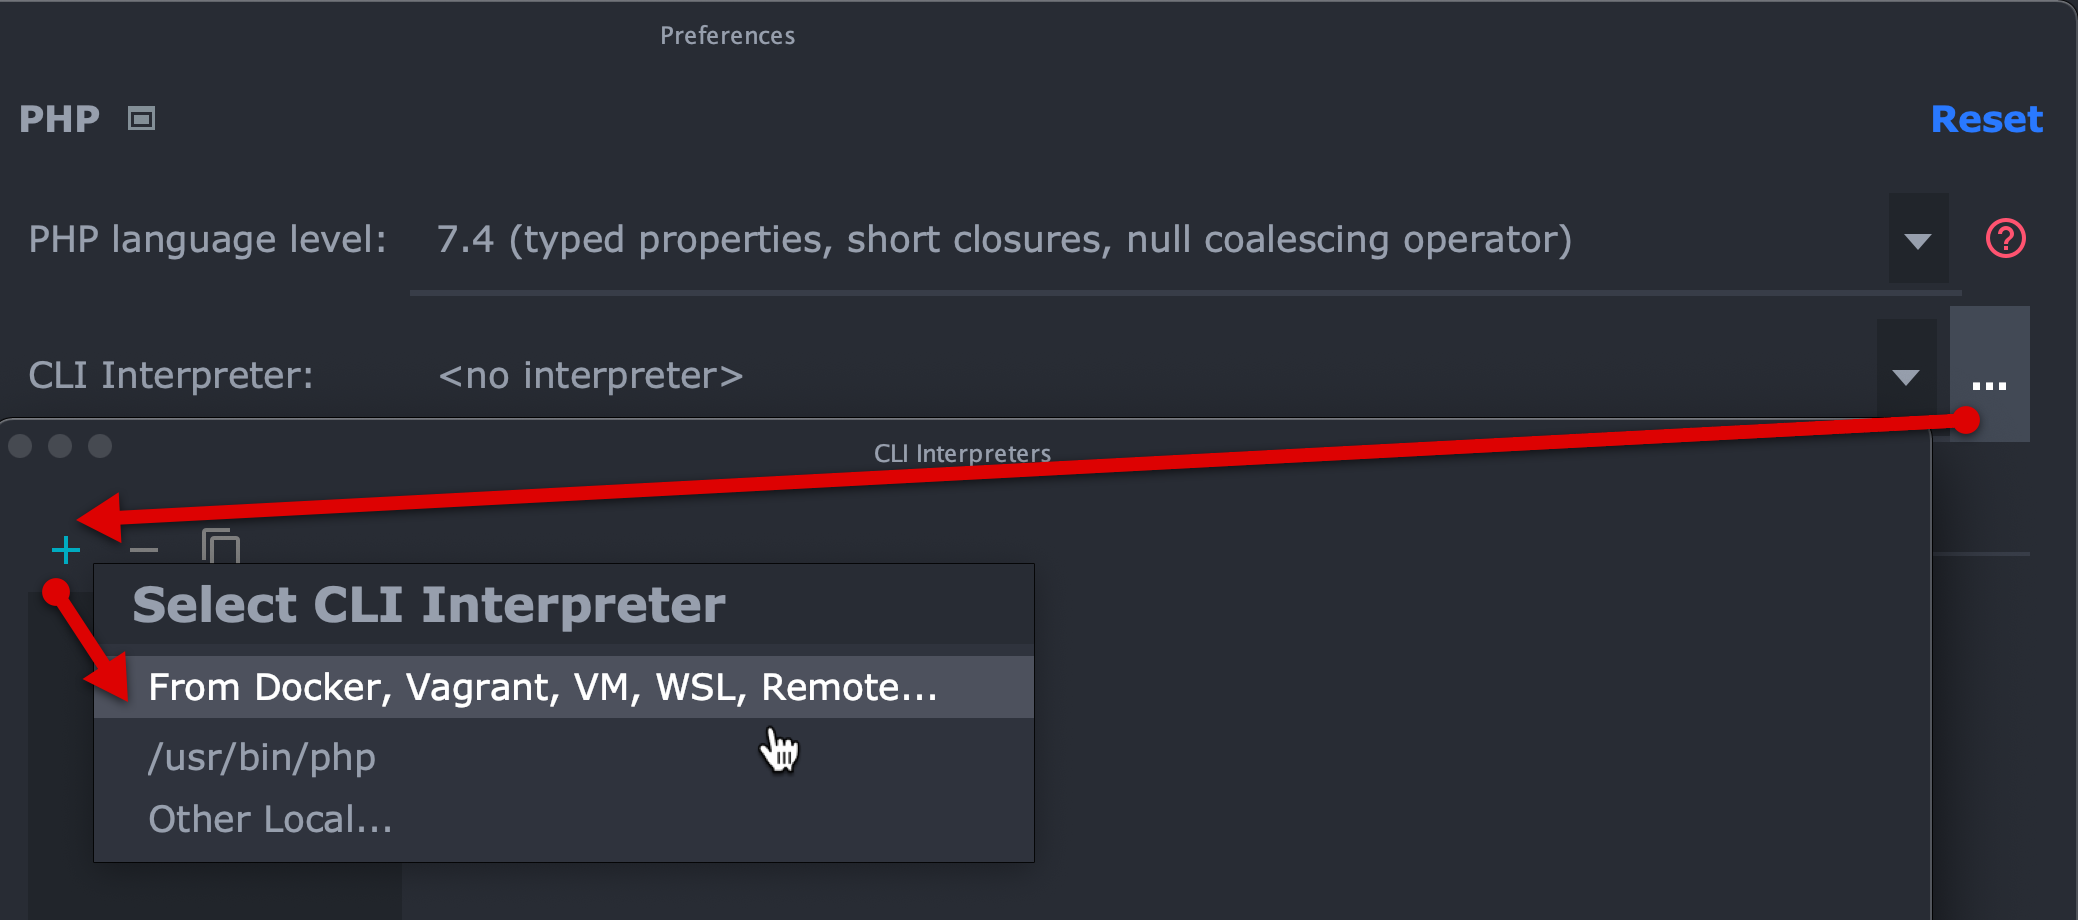
The first thing to do is to go to preferences and search for PHP. Here you will want to set PHP 7.4 as the language level. Next click on the three vertical dots to choose a CLI interpreter.

Configure the CLI interpreter
Here you will choose "From Docker..."

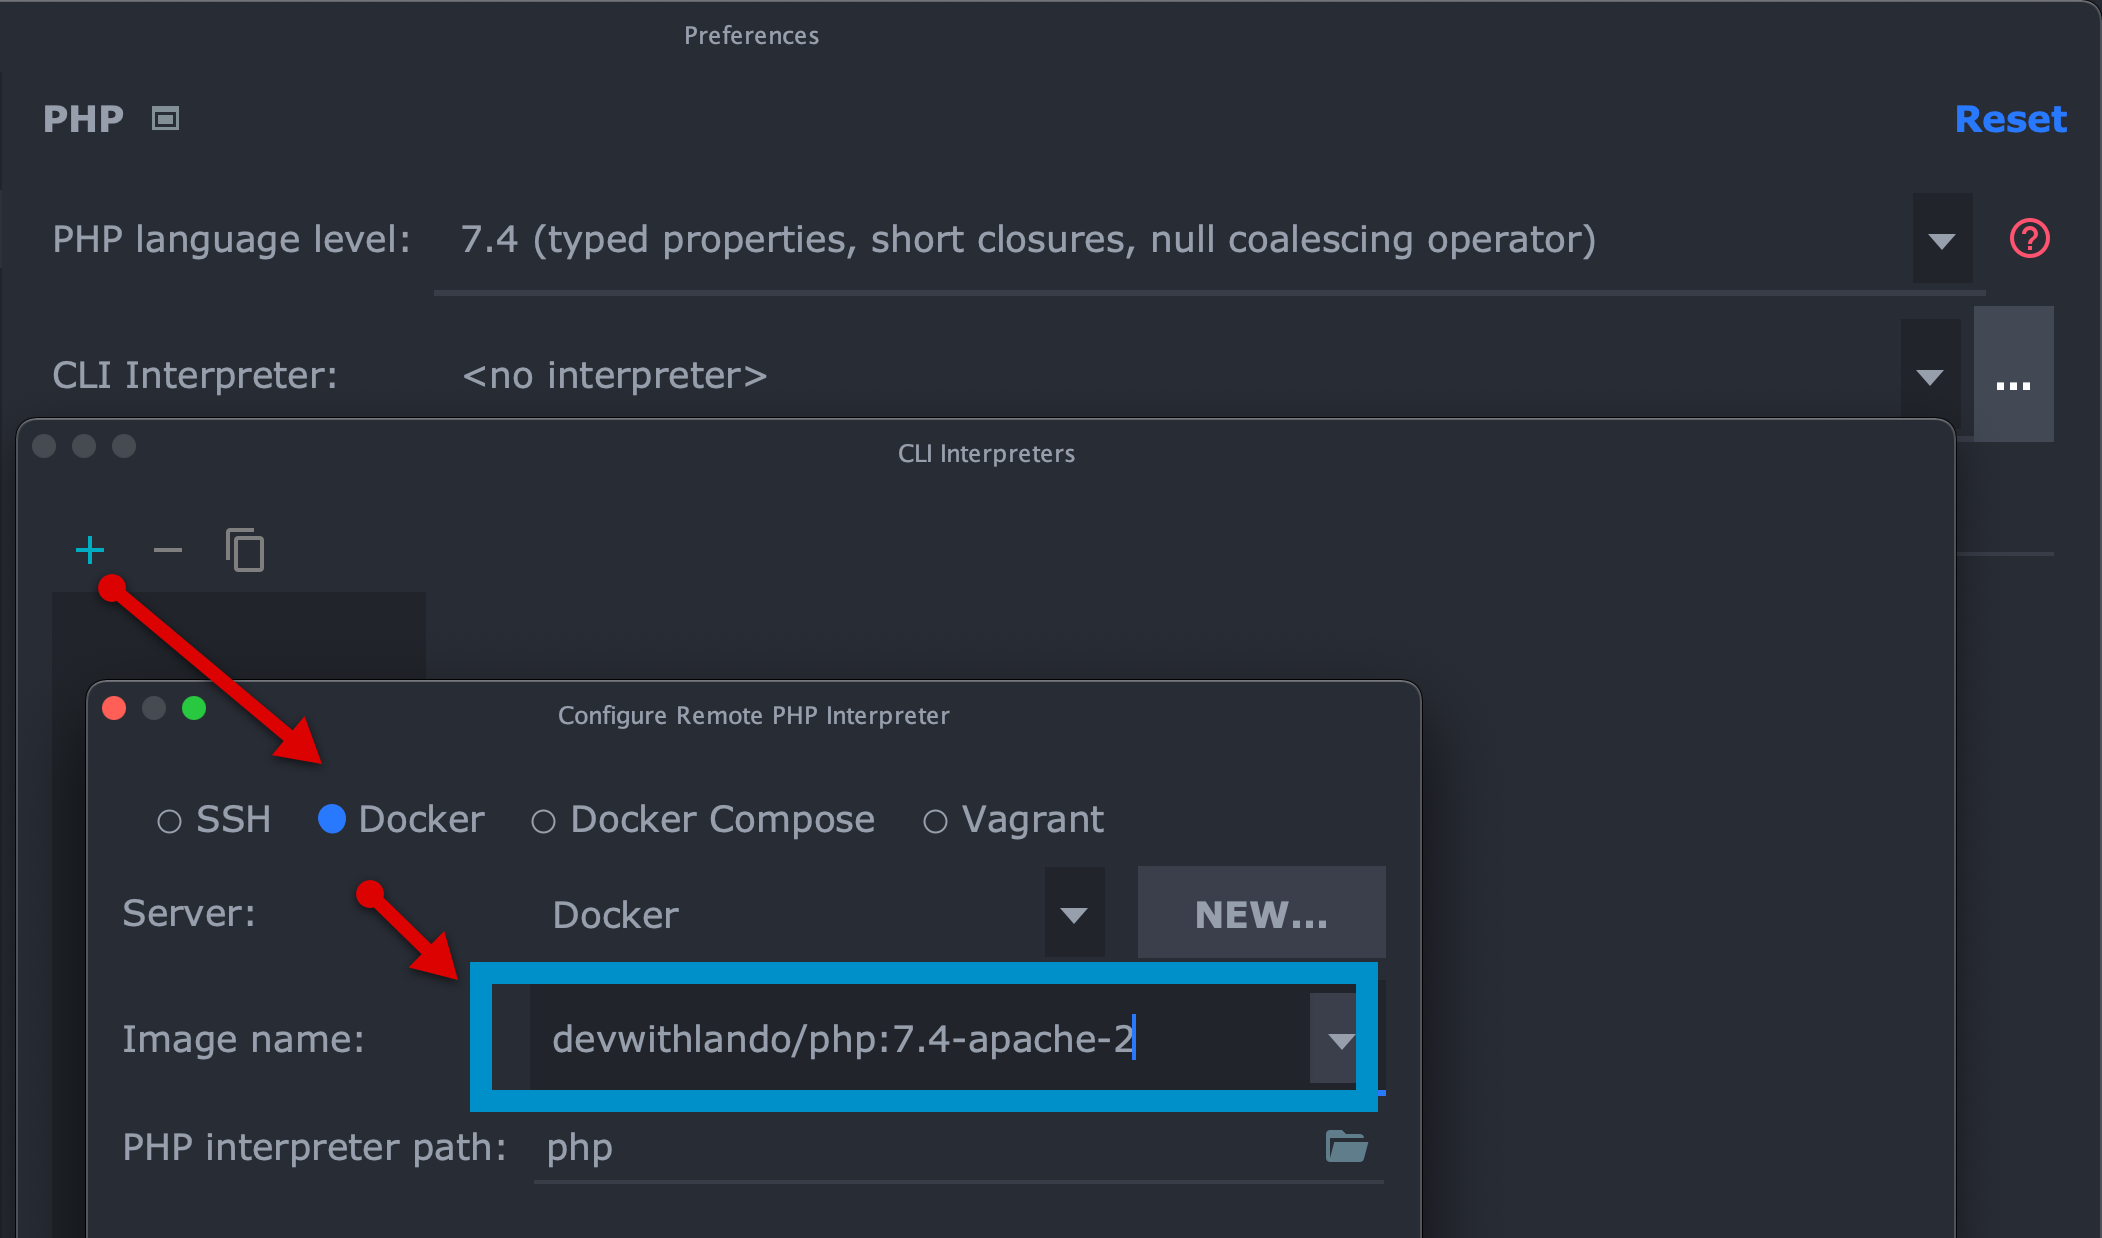
Choose the CLI image name
Here you will choose "Docker" and then the image name, in our case devwithlando/php:7.4-apache-2. Now click apply and ok to save all these settings.

Trigger Xdebug
Now for the final step, we are ready to trigger Xdebug with the steps below.
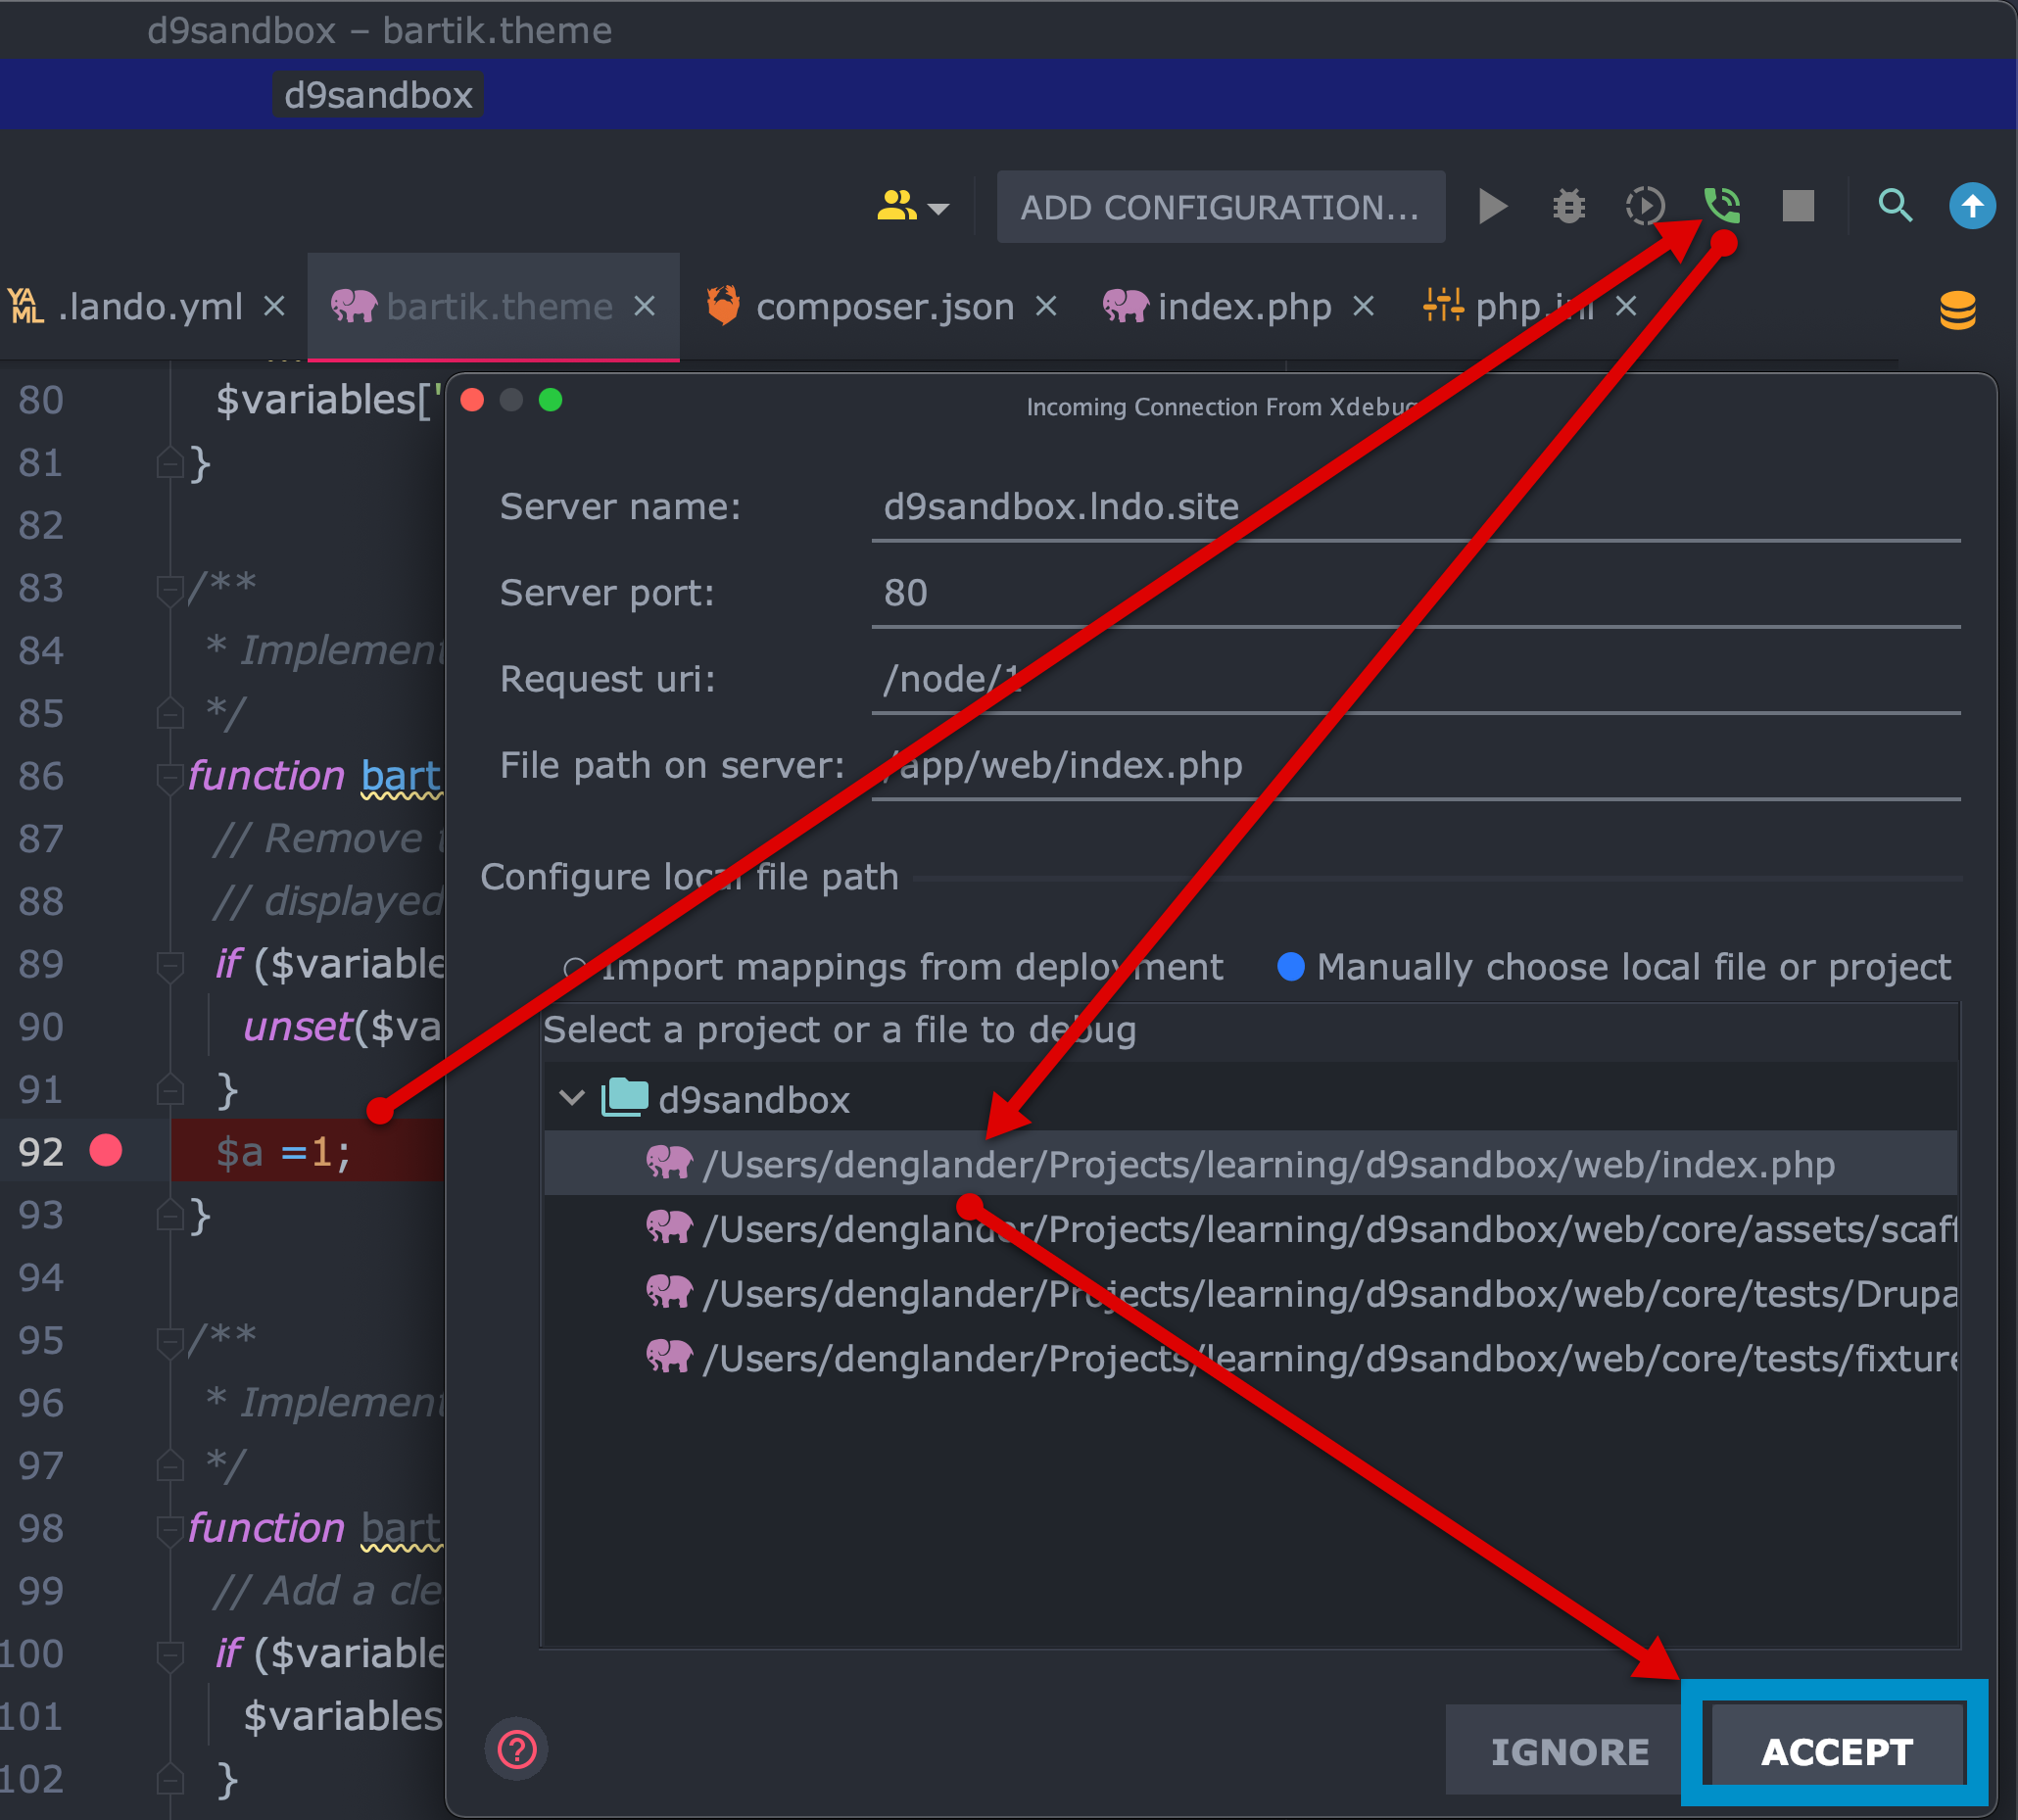
- Input a variable to set a breakpoint for. In the example, below, I've set a fake variable,
$a =1;withinfunction bartik_preprocess_node(&$variables){...} - Run
lando drush cr - Click in the left margin parallel to the variable so that you see a red dot.
- Click on the Phone icon at the top of the IDE so that it turns green. This is the "listener" where we set PHPStorm to listen for incoming connections so as to trigger Xdebug.
- Now click accept after choosing
index.php. This is a standard convention. - If all goes well, you will now see Xdebug get triggered. Click “Accept.”

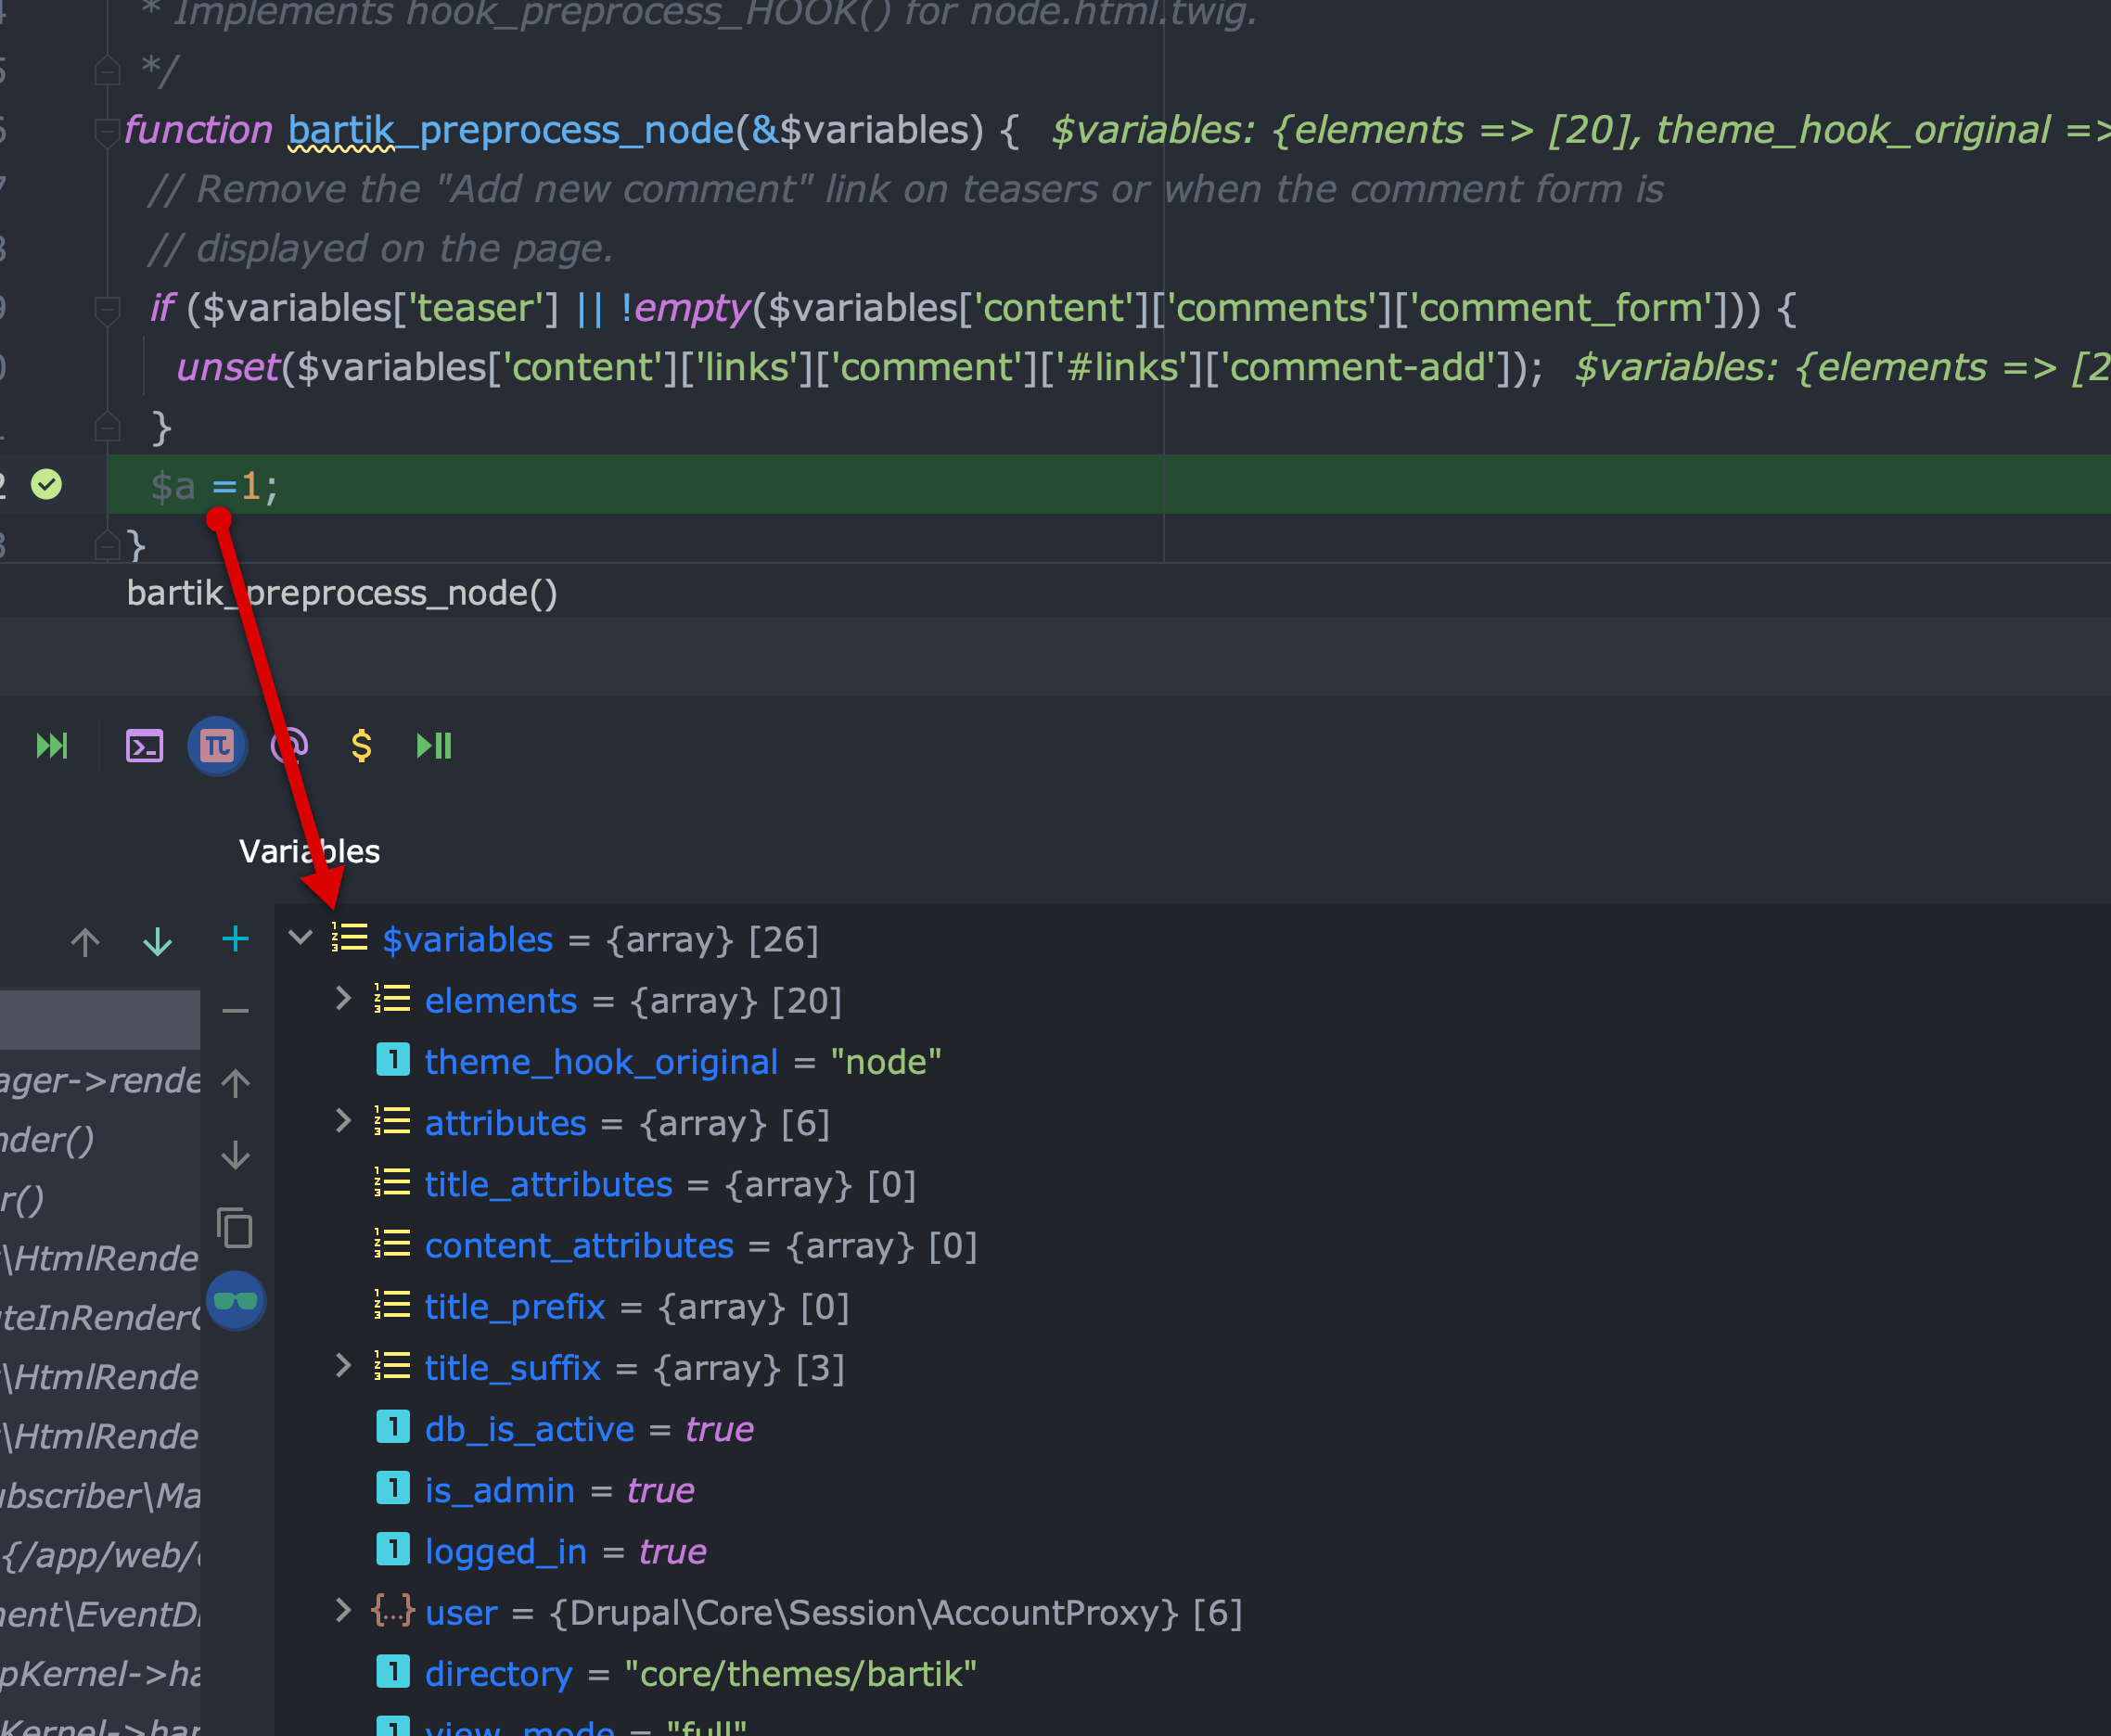
View Xdebug output
Once the above is set, you should now see the actual output from Xdebug as shown below. Thereafter, you can inspect arrays to your heart’s content!

Tips and Tricks
- I have found that occasionally, if other Lando projects are running, Xdebug will sometimes not be triggered so it might be best to only run one project at a time. To do that, run these commands in the root of your project.
lando poweroff
lando start
- If for some reason the listener does not trigger Xdebug, stop it and clear Drupal cache. Then start listening again.
Summary
Hopefully this article has helped to get up and running with Lando and Xdebug 3 with PHPStorm. I cannot stress enough how useful Xdebug is when working on a Drupal website. I’ve seen folks struggle with using Kint, print_r(), and var_dump(). While these are somewhat useful, to me nothing compares to the speed, preciseness, and usefulness of Xdebug.